Deployment of the concept of the fractal in correlation to the mechanical performance and availability of escalators for passenger service (Part 1)
by Dr. Ali Albadri
Traces of data have been collected and downloaded from the electronic “smart step” system, which had been run in an unloaded escalator to detect the heartbeat of the escalator. The data traces have been quantified as single values, using the fractal dimension concept, (Df). A successful technique has been deployed to determine the Df of each trace. A consistent and plausible linear relationship has been achieved on the log-log scale.
Categorizing and classifying escalators to a Df set can open new initiatives in correlating these values to the mechanical performance and availability of escalators for passenger service. They will give a reliable reflection of the mechanical operation and quality of escalator sub-mechanical systems. For example, Df values can give true quantified reflection of the quality of the tracks for different areas of an escalator. Step stress levels can be correlated to the quality of the tracks and, hence, to value of Df.
Introduction
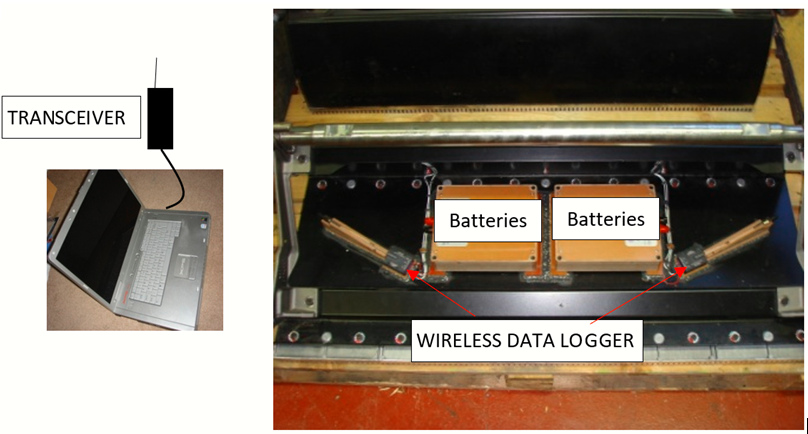
Since introducing the smart step for the escalator industry, your author and his team have been using it extensively in a wide range of escalator types.[1] The smart step has been deployed to detect the “heartbeat” of the escalator. The trace from the heartbeat gives excellent digital data about the mechanical health of the escalator. It shows how smoothly or roughly it is running. It quantifies the interaction between the step and various mechanical components inside. It gives direct and accurate information about the level of stresses and deflections under which the escalator step band is. It could also quantify the vibration levels inside an escalator.
The smart step has become a vital detection tool in escalator maintenance. Stress, deflection and vibration levels can be stored in its electronic system. The electronic system can be communicated with via Bluetooth in the vicinity of the escalator (approximately a 15-m radius) or at greater distances using Bluetooth in combination with the internet.
The objective of this work is, first, to quantify and handle the signals from the smart step easily and reliably. Then, most importantly, it is to use the values to categorize the quality and reliability of the escalator. This will be achieved using the concept of Df, which has been used to measure the complexity of an electronic signal/trace. Generally, complexity can be analyzed in the time domain, frequency domain and phase space of the system. Analysis in frequency domain requires Fourier transformation of the signal, while analysis in the phase space requires embedding of the data in a higher dimensional space. Conversely, Df is a descriptive quantitative measure, a single number that quantifies complexity of a signal.[2]
New ideas for finding nonlinear dynamic mechanical systems that may have direct application on manufacturing processes from machining, grinding, rolling, etc., have been studied and modeled.[3] This investigation’s goal is to establish whether signals from a tool like the smart step can be quantified by using the Df concept.
Methodology Used to Determine Df
The scaling step technique has been used here to determine Df. A computer program was written in Microsoft Excel to determine Df and plot the data. Our methodology is very similar to the Multiresolution Length Method, which has been used by many researchers.[3-5]
The steps in the time series = s = {s(0), s(1), s(2), s (3), . . .s(n)} of length n of the trance. Each point in the plot is represented in (xi, yi) when i = 1, 2, 3, . . .n. xi values are abscissa, and yi values are ordinate values. The Euclidean distance between two points (x1, y1) and (x2, y2) is:
dist(s1, s2) = ((x1 – x2)2 + (y1 – y2)2)0.5 (1)
The total length of the curve of the first-time resolution is calculated as:
L = I = 1∑n – 1 dist(si, si + 1) (2)
It is noted that, as the resolution becomes coarser, the estimated length of the time series becomes less accurate. Repeat the above for different resolutions, (r = r1, r2, r3, r4, . . .rp, where rp is the maximum coarsest resolution at which the length of the curve is calculated.
By drawing a log-log graph (1/rk) versus (Lr) and computing the slope, the fractal dimension is calculated from:
(Df – 1) = -[log(Lr)/log(1/rk)] = -[slope] (3)
A smart step was built to run in a newly, fully refurbished escalator. Eight strain gauges were mounted at different locations in the step (Figure 1). The gauges were located at critical locations in the step after conducting finite element analysis simulation on a 3D model for the step. The step was loaded by doing axial, torsion and chain differential tests per the recommendations in the BS EN 115 standard.
Results and Discussion
Figure 2 shows data of the traces for the nine strain gauges, which were downloaded from the smart step after running the escalator for more than 15 min. Unfortunately, strain gauge no. 2 developed a malfunction; therefore, the data from this gauge is ignored. The shape of the traces (number of peaks and troughs) gives a clear indication as to how smooth or rough the tracks are in various areas of the escalator. The very high or low peaks in the trace can show where exceptional events are occurring. This subject will be discussed in depth in a future article.
-
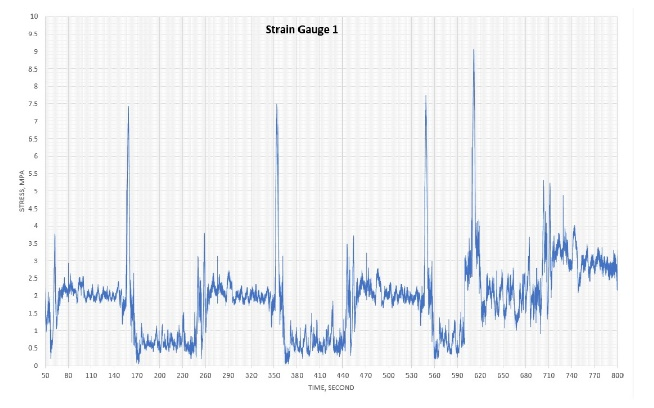
Figure 2: The full spectrum of measurements recorded by the strain gauges from the smart step -
Figure 2: The full spectrum of measurements recorded by the strain gauges from the smart step -
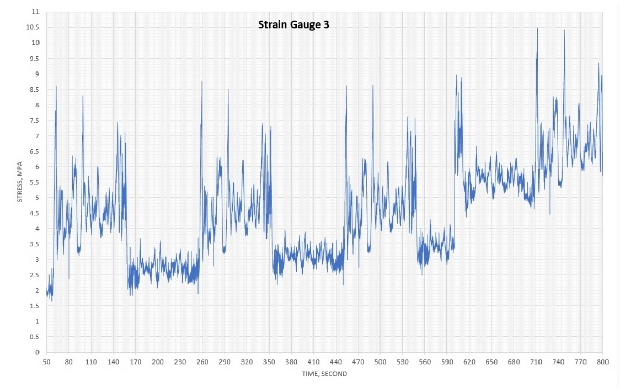
Figure 2: The full spectrum of measurements recorded by the strain gauges from the smart step -
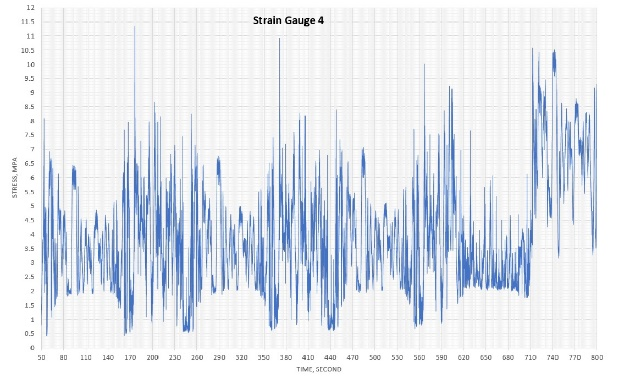
Figure 2: The full spectrum of measurements recorded by the strain gauges from the smart step -
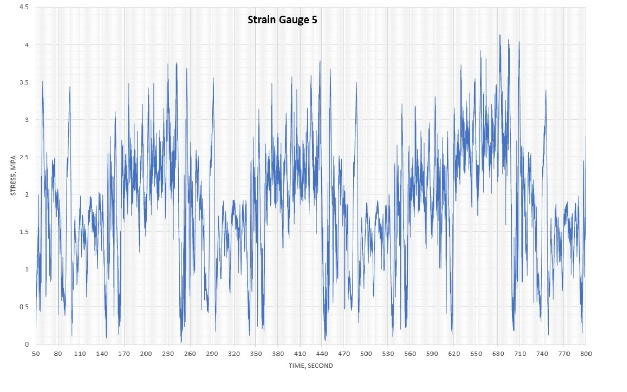
Figure 2: The full spectrum of measurements recorded by the strain gauges from the smart step -
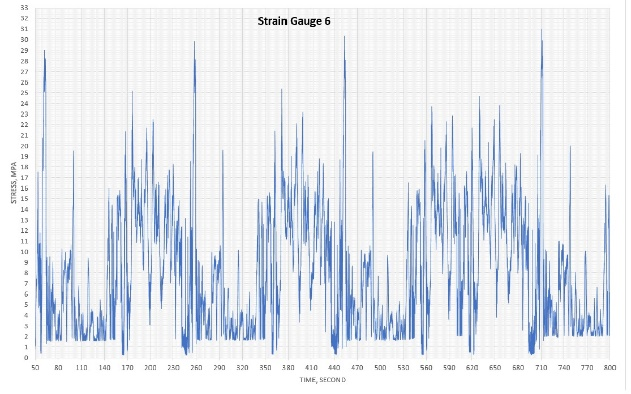
Figure 2: The full spectrum of measurements recorded by the strain gauges from the smart step -
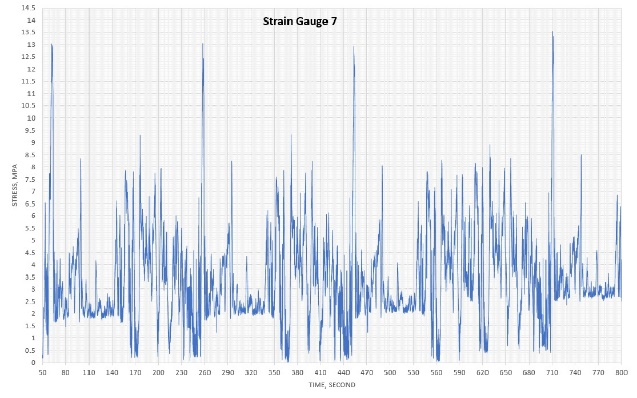
Figure 2: The full spectrum of measurements recorded by the strain gauges from the smart step -
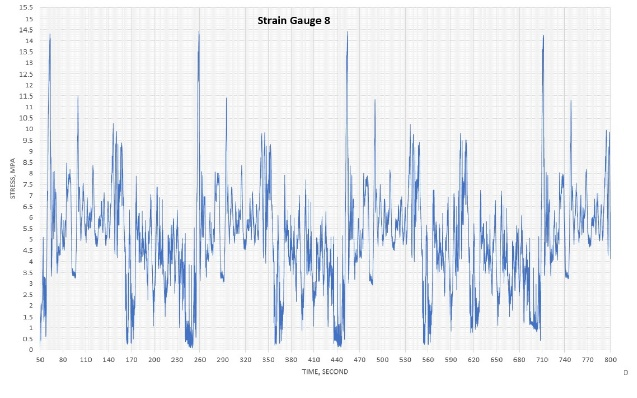
Figure 2: The full spectrum of measurements recorded by the strain gauges from the smart step -
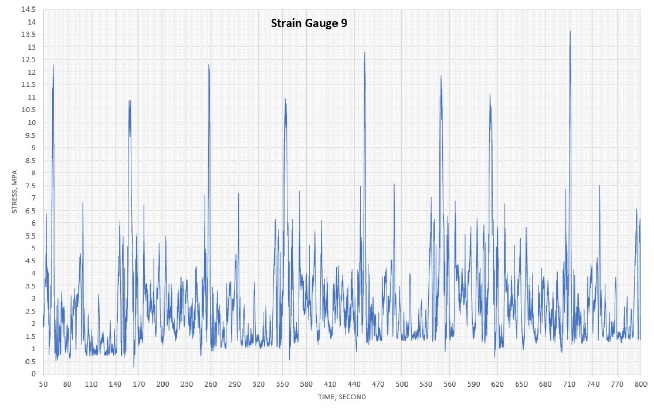
Figure 2: The full spectrum of measurements recorded by the strain gauges from the smart step -
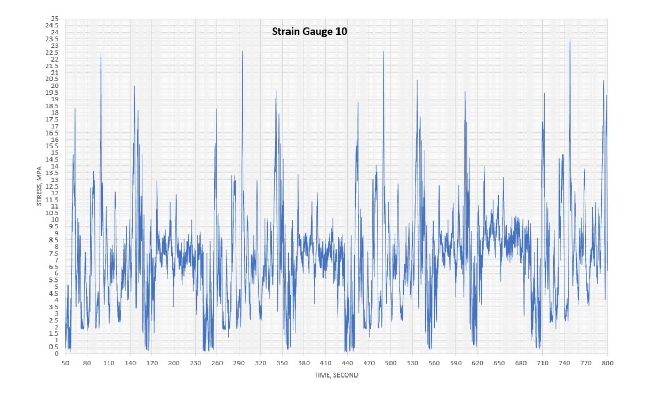
Figure 2: The full spectrum of measurements recorded by the strain gauges from the smart step
Figure 3 shows log-log plots for all nine gauges. Df was determined for each gauge (Table 1). The plots show good linear relationships with easily estimated slopes and, hence, Df.
-
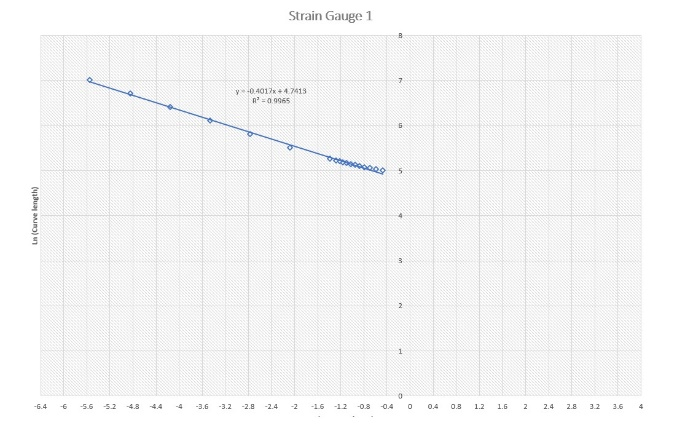
Figure 3: The plots for all strain gauges in the smart step to estimate Df -
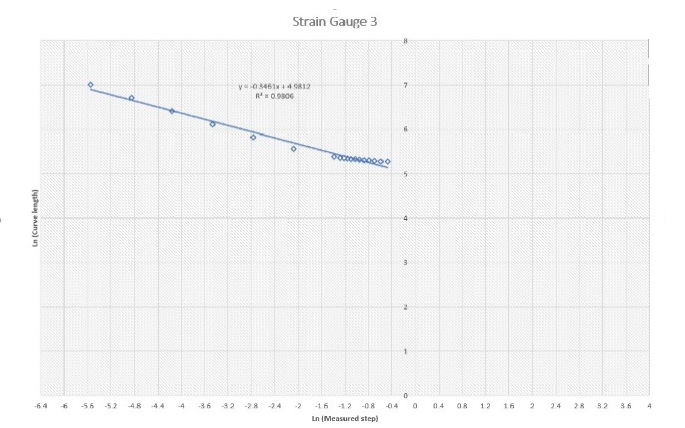
Figure 3: The plots for all strain gauges in the smart step to estimate Df -
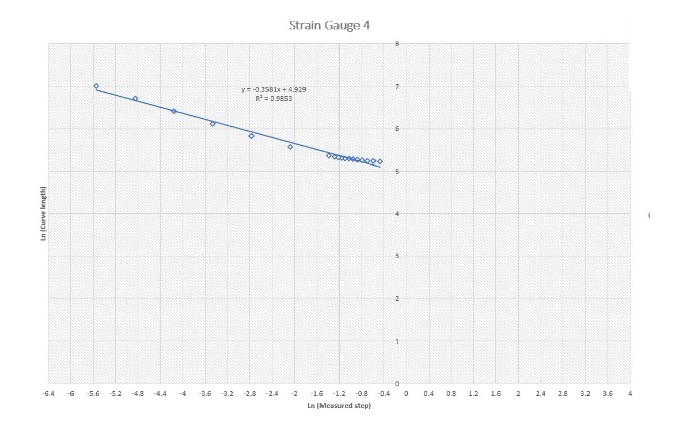
Figure 3: The plots for all strain gauges in the smart step to estimate Df -
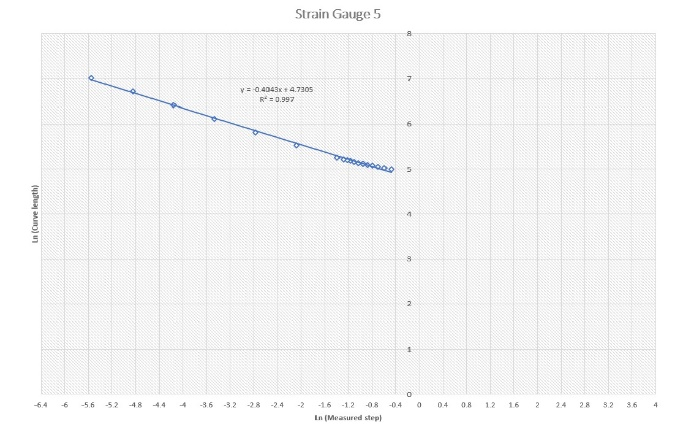
Figure 3: The plots for all strain gauges in the smart step to estimate Df -
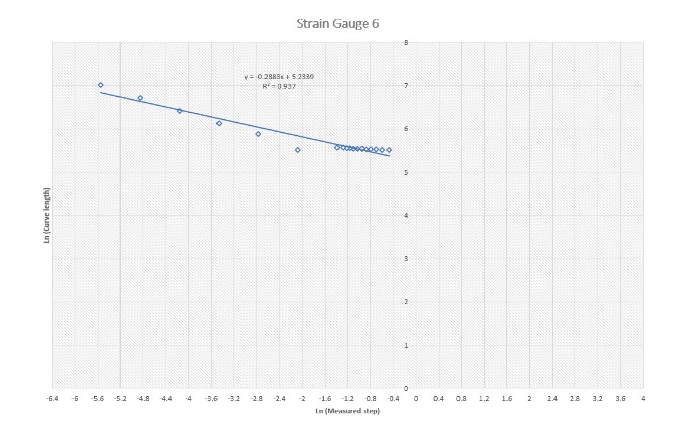
Figure 3: The plots for all strain gauges in the smart step to estimate Df -
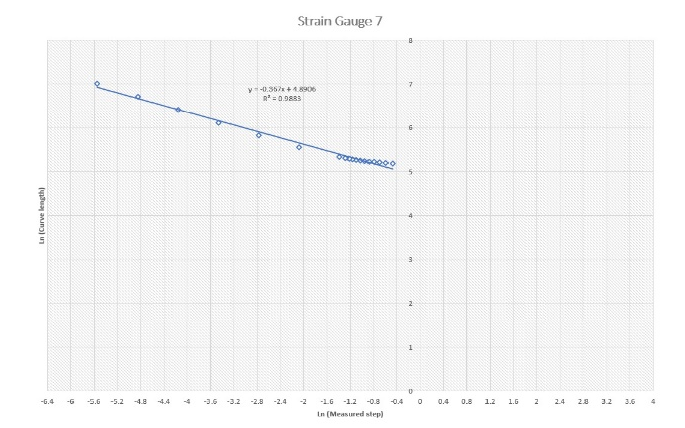
Figure 3: The plots for all strain gauges in the smart step to estimate Df -
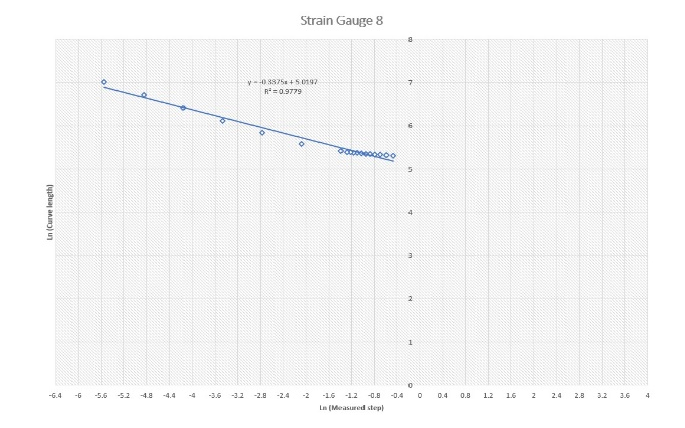
Figure 3: The plots for all strain gauges in the smart step to estimate Df -
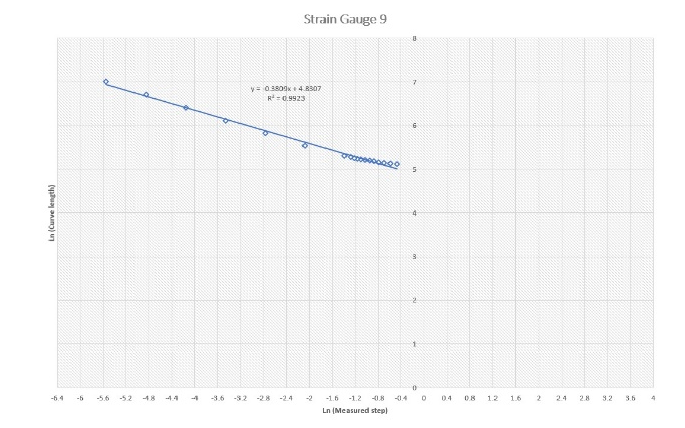
Figure 3: The plots for all strain gauges in the smart step to estimate Df -
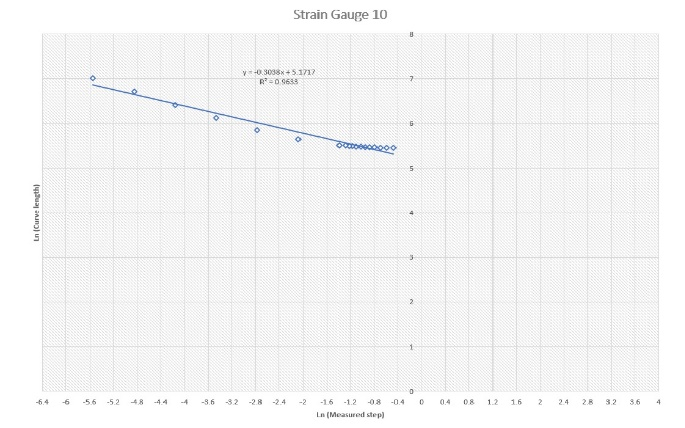
Figure 3: The plots for all strain gauges in the smart step to estimate Df
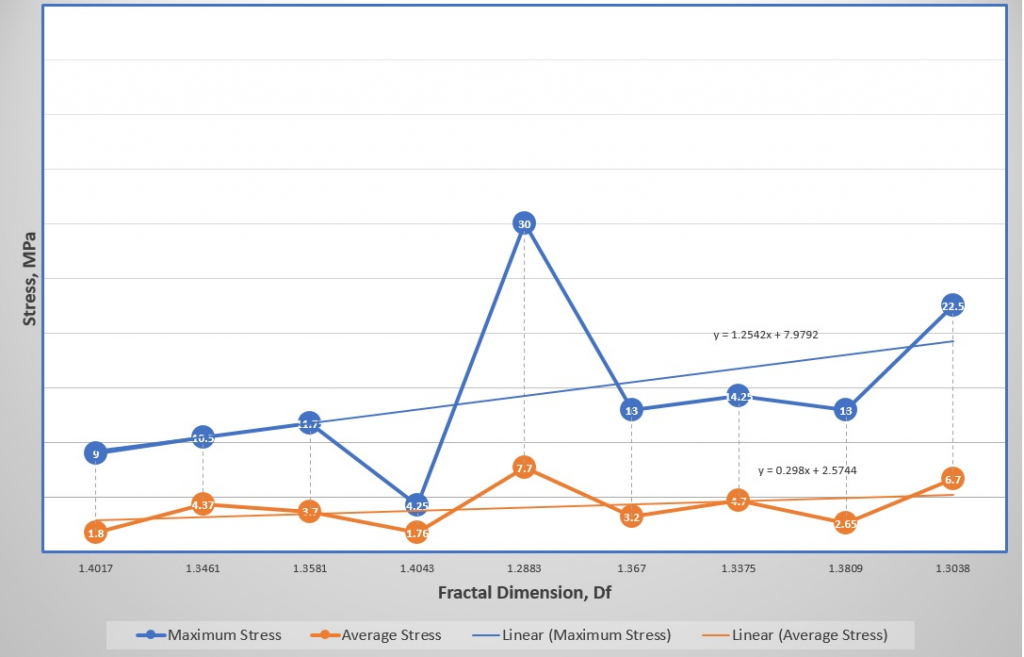

The relationship between the maximum and average measured stresses are plotted against the values of the assessed Df. Although there are weak relations between the parameters in the plot, the graphs suggest the potential of an interesting relationship between them. This encourages us to proceed with further investigations.
Conclusions
The systematic, repeatable and consistent patterns of the traces from the smart step have encouraged us to quantify the quality of these traces to values by using the fractal dimension concept. This study has proven that Df can be used as a tool to classify and categorize escalators in ranking, depending on their quality of build, design and maintenance regime. It also suggests the potential of correlating Df values to many other variables, such as maximum and average stress levels in the step band. The effect of passenger loading and the generated stress levels on Df will be studied in the next publications.
References
[1] A. Albadri. “Tube Lines Gets Smart to Monitor Escalator Wear,” Computer Weekly (07/01/2008).
[2] B.S. Raghavendra and D. Narayana Dutt. “Computing Fractal Dimension of Signals Using Multiresolution Box-Counting Method,” World Academy of Science, Engineering and Technology 37 (2010).
[3] D. Scheianu and I. Tutanescu. “Application of Fractal Signal,” University of Piesti, Communication and Computer Department.
[4] A. Zlatintsi and P. Maragos, “Multiscale Fractal Analysis of Musical Instrument Signals With Application to Recognition,” IEEE Transaction on Audio, Speech and Processing, Vol. 21, no. 4 (April 2013).
About the Author

Dr. Ali Albadri is chief engineer for Tube Lines Specialist Services. He has worked for the University of Manchester Institute of Science and Technology (UMIST), Brunel University, Oxford University and the industry. He was a materials scientist for Cookson Group, design engineer for ABB and senior design engineer for Olympus the Hydronix. He holds a PhD from UMIST and has published papers for various industries, including vertical transportation.